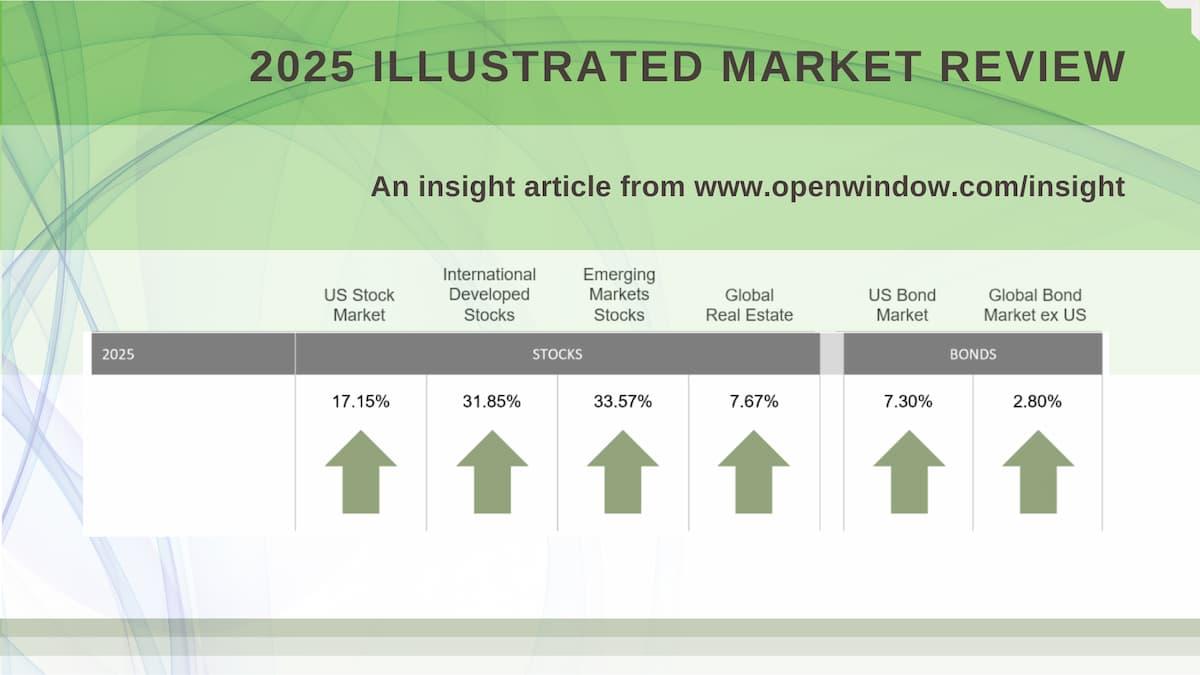
2025 Illustrated Market Review
 |
Key Takeaways
|
By almost any scoreboard measure, 2025 was a good year for investors.
Stocks rose across the globe. Bonds finally contributed again. Commodities surprised to the upside. Even after navigating geopolitical conflict, shifting interest-rate expectations, tariff uncertainty2, political dysfunction at home, and questions about the durability of gains tied to artificial intelligence, markets delivered broadly positive results.
And yet, as always, the most important story of the year is not found in the headlines or the point totals. It is found in how markets behaved, how winners shifted, and the discipline required to stay focused on your long-term intentions.
Good Returns Rarely Arrive Quietly
US stocks posted their third consecutive year of double-digit gains. International and emerging markets did even better. Bonds rewarded patience after several difficult years, all serving to remind investors that waiting is often part of achieving available returns.
On paper, it looks reassuring. Living through it felt different.
Markets saw sharp swings in sentiment, sector winners rotated, and uncertainty remained a constant. Record highs were followed by uncomfortable pullbacks. Enthusiasm around artificial intelligence was questioned, revived, and questioned again. Policy headlines created noise, but little lasting signal.2
This is how markets typically work. The discomfort is not a bug; it is the price of admission. Patience is, therefore, an active choice to stick to the plan despite uncertainty.
Winners Change, Again
One of the clearest lessons of 2025 was the danger of assuming yesterday’s winners will continue to lead tomorrow.
US stocks performed well, but they were not the strongest performers globally. Developed international and emerging markets outpaced the US, reversing a trend many investors had come to view as permanent. Real estate returns diverged sharply between US and non-US markets. Commodities, long dismissed by many, delivered meaningful gains driven by precious metals.
These shifts were not predictable in advance, but they were entirely consistent with market history.
Bonds Quietly Did Their Job
After several years in which bonds tested investor patience and discipline, 2025 offered a reminder of their role.
As interest rates declined across much of the US yield curve, fixed income once again provided income, stability, and ballast. Short- and intermediate-term bonds produced solid total returns across Treasuries, corporates, and municipals. Globally, bond markets reflected the uneven nature of inflation and growth, reinforcing the importance of structure rather than speculation.
Bonds are rarely exciting. When they are working properly, they are reassuring. In 2025, they quietly did what they are supposed to do. Their value shows up most clearly for investors willing to hold them when they feel unnecessary.
Volatility Is Not the Same as Risk
It is easy to conflate volatility with danger. When markets move and prices fluctuate, headlines amplify fear or euphoria. But short-term movement is not the same thing as long-term risk.
The real risks to investors tend to be behavioral: temptation to abandon discipline during periods of discomfort in favor of what has worked recently.
The core of your investment plan isn’t the markets, individual securities, or even returns. It’s about you—your intentions, values, and vision for the future. What do you and your family hope to achieve in the years ahead? What brings meaning and fulfillment to your life? These are the questions that should guide your financial strategy, not a guess about what might be next.
Discipline is what keeps those answers intact when markets get noisy.
Diversification can help keep the noise at a reasonable volume.
Diversification can help when markets get noisy. Diversification is one of the most effective tools you have to navigate uncertainty. It exists to prevent regret when strong years feel uncomfortable. It matters when markets keep soaring, and when they stop, or in the meantime whenever volatility threatens to distract from long-term purpose.
Diversification exists because yesterday’s winners inevitably fall out of favor, and tomorrow's winners are obvious only in hindsight. It exists just in case bonds do their quiet work in some years but not in others. Diversification is not about forecasting these shifts; it is about respecting that they will happen. It helps us make the most of uncertainty, compensating investors not because the path was smooth, but because they stayed invested through it.
The data that follows below shows that markets rewarded patience, discipline, and diversification again in 2025.
Market Summary
2025 INDEX RETURNS
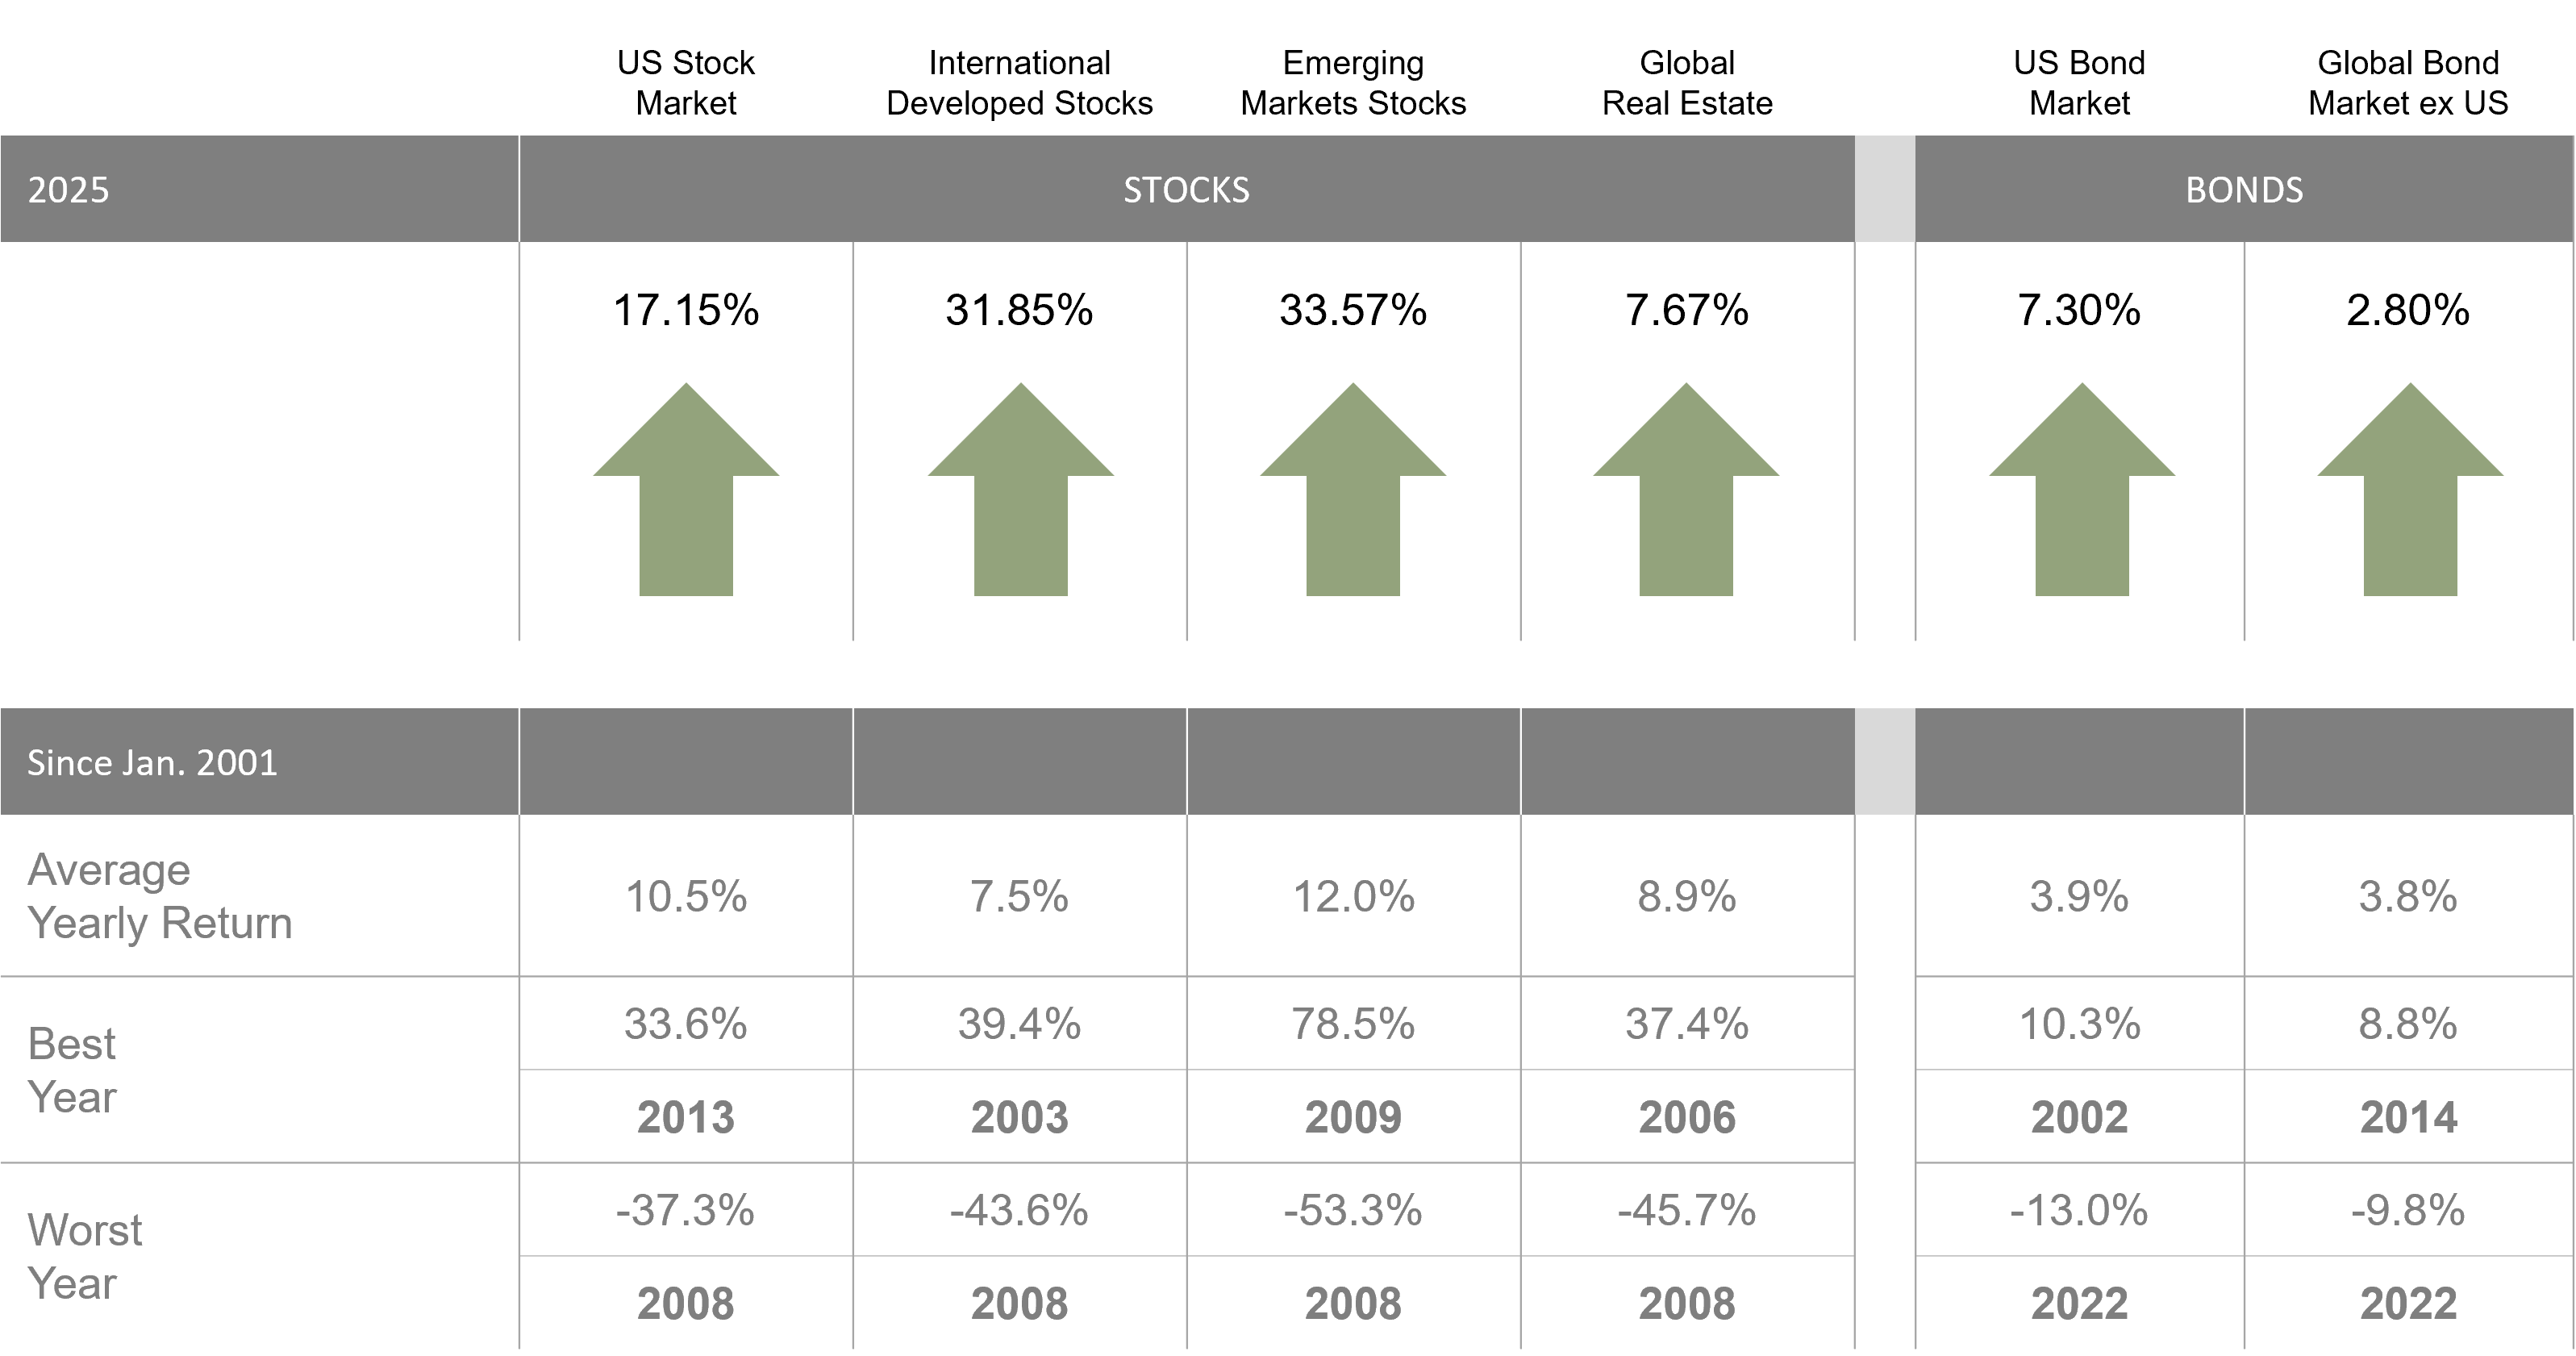
Past performance is not a guarantee of future results. Indices are not available for direct investment. Index performance does not reflect the expenses associated with the management of an actual portfolio. Market segment (index representation) as follows: US Stock Market (Russell 3000 Index), International Developed Stocks (MSCI World ex USA Index [net div.]), Emerging Markets (MSCI Emerging Markets Index [net div.]), Global Real Estate (S&P Global REIT Index [net div.]), US Bond Market (Bloomberg US Aggregate Bond Index), and Global Bond Market ex US (Bloomberg Global Aggregate ex-USD Bond Index [hedged to USD]). S&P data © 2026 S&P Dow Jones Indices LLC, a division of S&P Global. All rights reserved. Frank Russell Company is the source and owner of the trademarks, service marks, and copyrights related to the Russell Indexes. MSCI data © MSCI 2026, all rights reserved. Bloomberg data provided by Bloomberg.
US Stocks
2025 INDEX RETURNS
The US stock market posted positive returns for the year and underperformed both non-US developed and emerging markets.
US stocks notched their third year in a row of double-digit gains, but it wasn’t the smoothest ride. The S&P 500 hit records in the winter that were followed by a spring swoon. After powering past that to new highs in the fall, the markets cooled a bit along with the temperatures.3 Still, the S&P 500 was up 17.9% for the year and closed near record levels.4 The climb came despite tariff uncertainty, interest rate changes, and concerns about the durability of AI’s gains—not to mention the longest government shutdown in US history.5
Ranked Returns (%) - US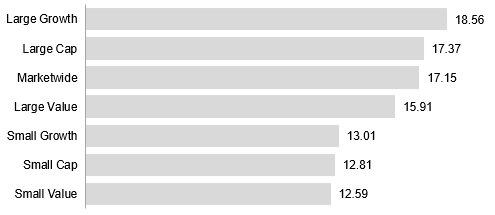
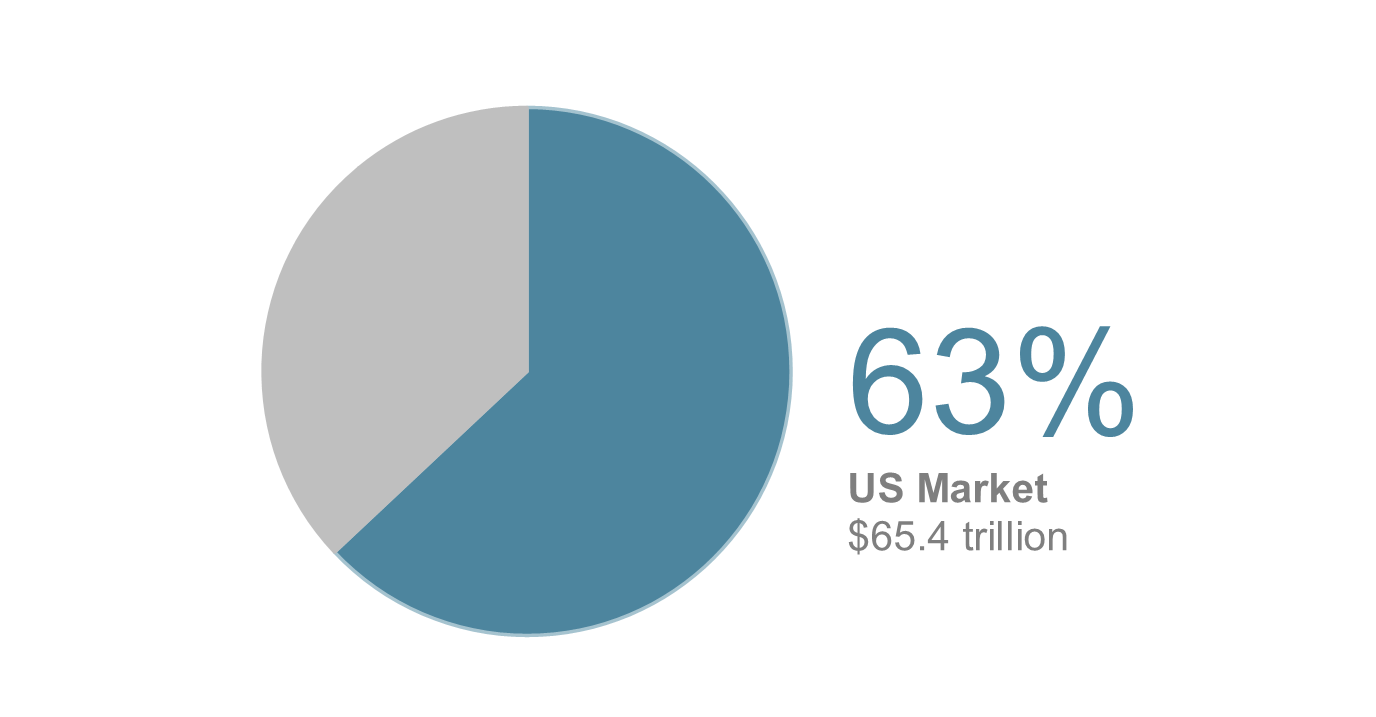
World Market Capitalization - US
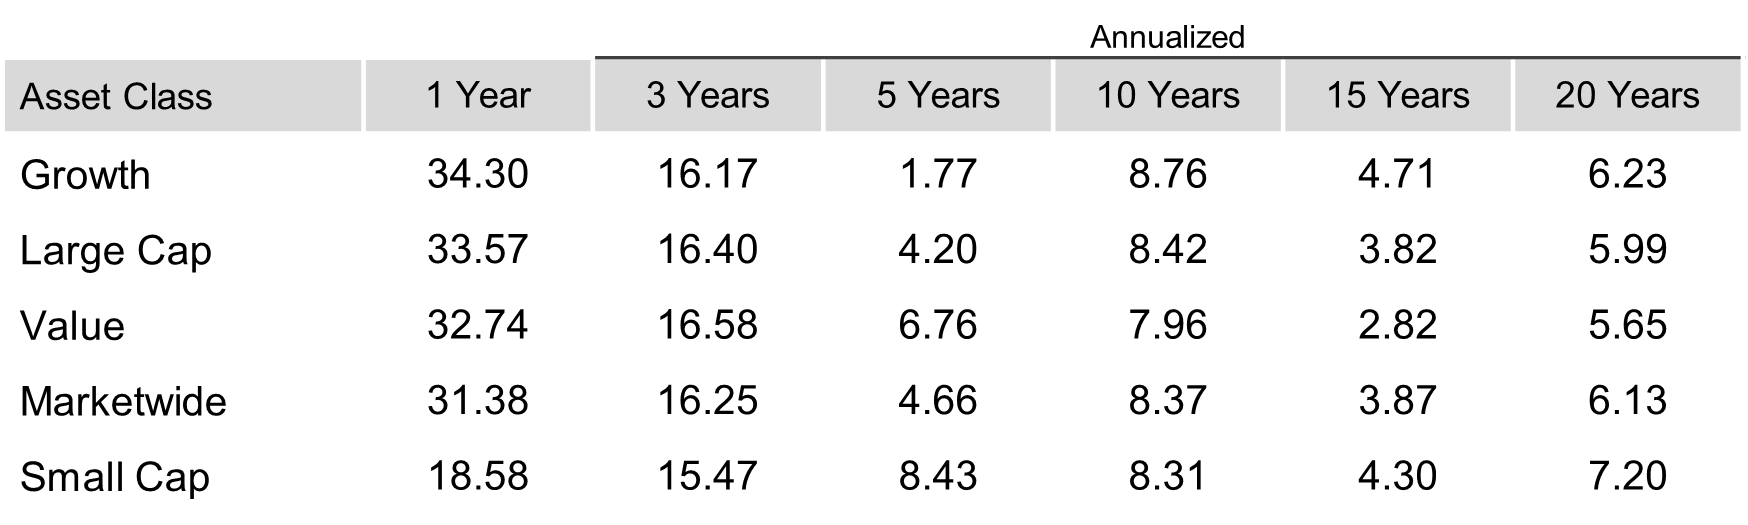
Period Returns (%) - US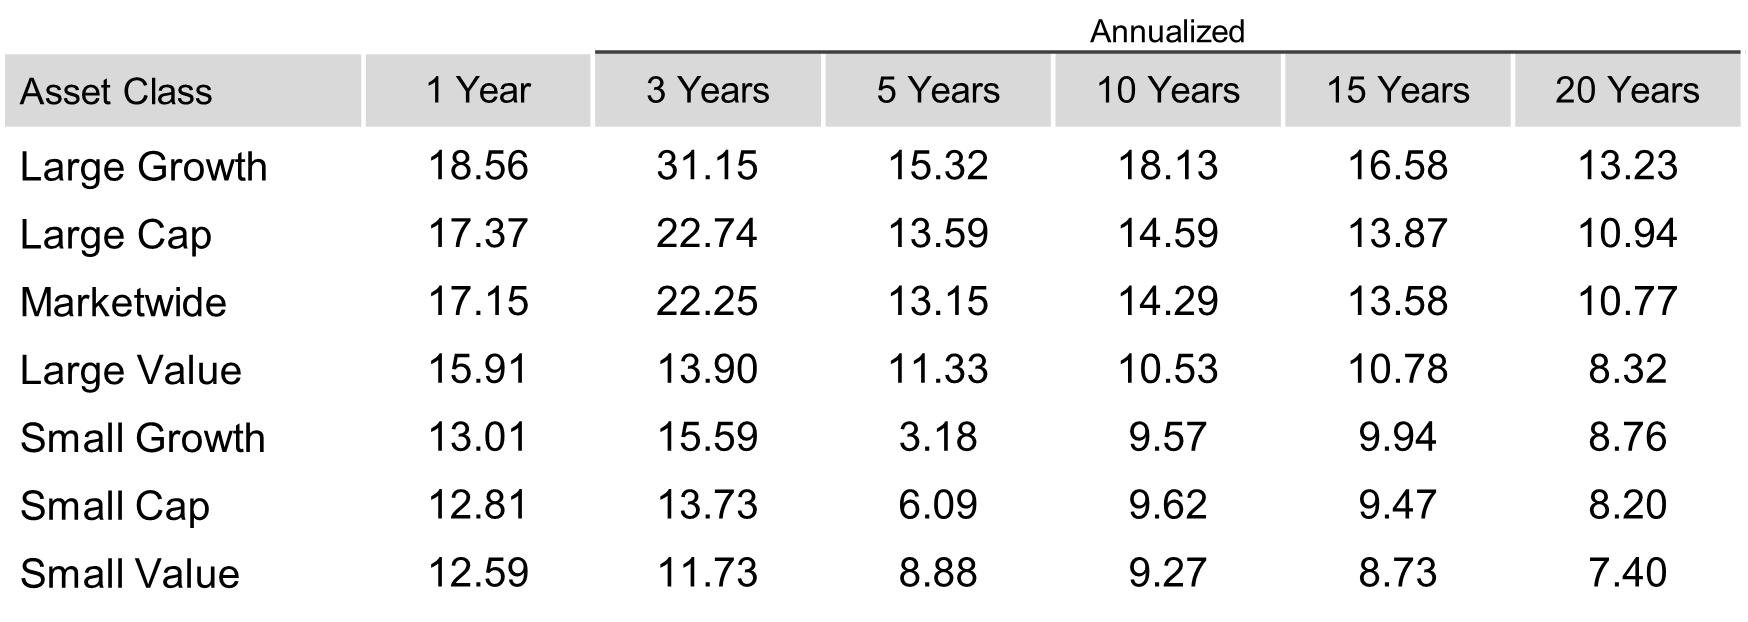
Past performance is not a guarantee of future results. Indices are not available for direct investment. Index performance does not reflect the expenses associated with the management of an actual portfolio. Market segment (index representation) as follows: Marketwide (Russell 3000 Index), Large Cap (Russell 1000 Index), Large Value (Russell 1000 Value Index), Large Growth (Russell 1000 Growth Index), Small Cap (Russell 2000 Index), Small Value (Russell 2000 Value Index), and Small Growth (Russell 2000 Growth Index). World Market Cap represented by Russell 3000 Index, MSCI World ex USA IMI Index, and MSCI Emerging Markets IMI Index. Russell 3000 Index is used as the proxy for the US market. Dow Jones US Select REIT Index used as proxy for the US REIT market. Frank Russell Company is the source and owner of the trademarks, service marks, and copyrights related to the Russell Indexes. MSCI data © MSCI 2026, all rights reserved.
Global Stocks
2025 INDEX RETURNS
Global stocks rose, with returns in developed international and emerging markets better than those in the US. Equities, as measured by the MSCI All Country World Index, rose 22.34% even as geopolitical tensions remained high, with trade wars as well as continued conflicts in the Middle East and Ukraine.
MSCI All Country World Index (net dividends), 2025
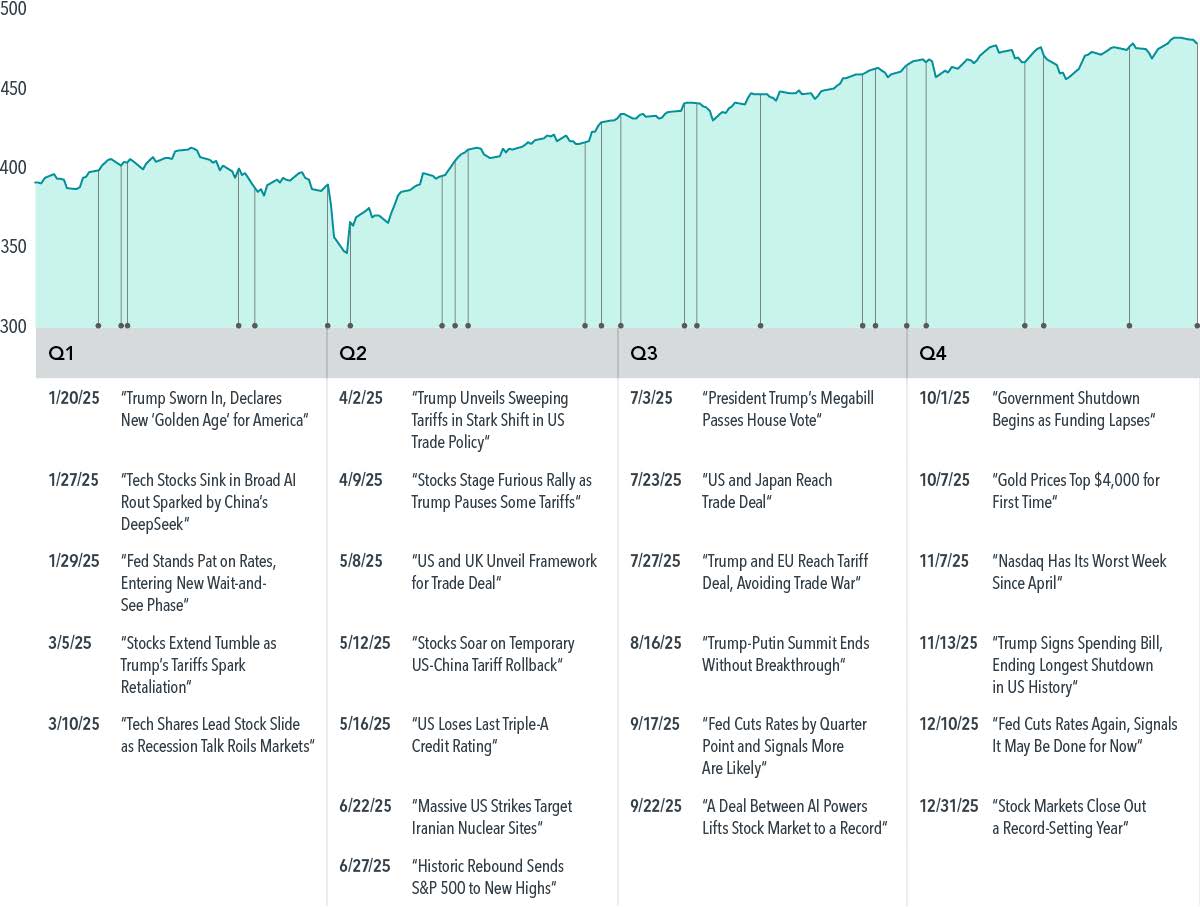
Past performance is not a guarantee of future results. In USD. MSCI All Country World Index, net dividends. MSCI data © MSCI 2025, all rights reserved. Indices are not available for direct investment; therefore, their performance does not reflect the expenses associated with the management of an actual portfolio. Headlines are sourced from various publicly available news outlets and are provided for context, not to explain the market's behavior.
The global stock market can be separated into two parts: (1) international developed stocks and (2) emerging market stocks.
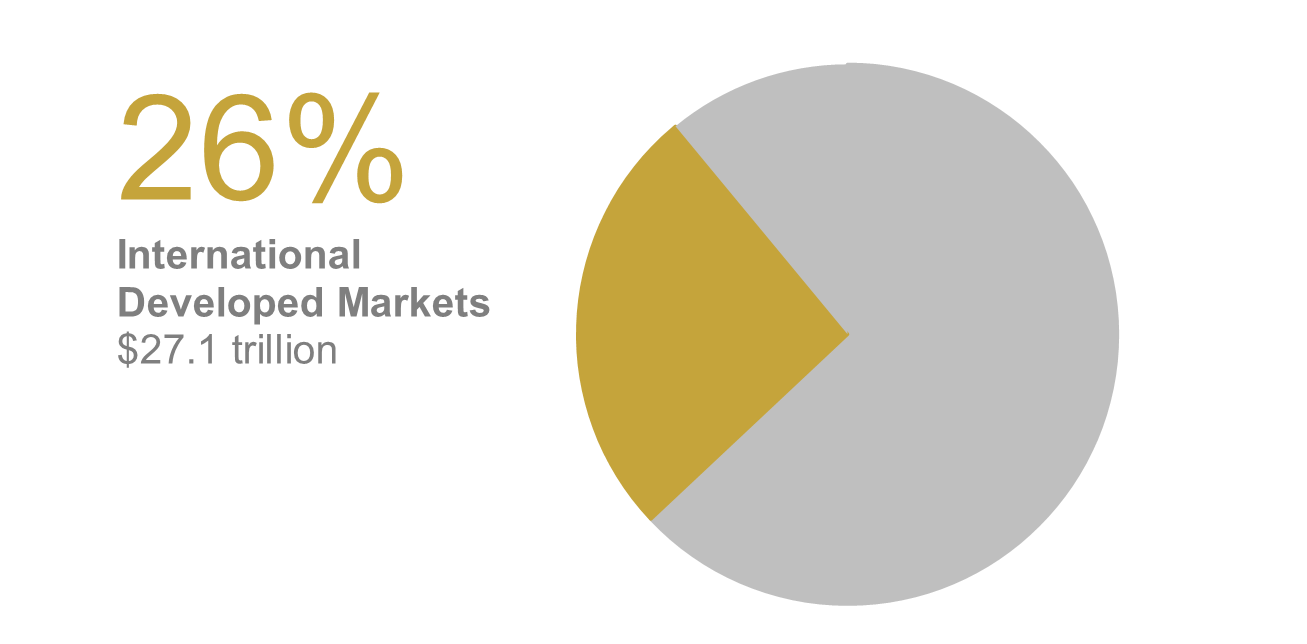
(1) International Developed Stocks
Developed markets outside the US posted positive returns for the year and outperformed US markets, but underperformed emerging markets. The MSCI World ex USA Index returned 31.85%.
Ranked Returns (%) - International Developed

World Market Capitalization - International Developed
Period Returns (%) - International Developed

Past results is not a guarantee of future results. Indices are not available for direct investment. Index results does not reflect the expenses associated with the management of an actual portfolio. Market segment (index representation) as follows: Marketwide (MSCI World ex USA IMI Index), Large Cap (MSCI World ex USA Index), Small Cap (MSCI World ex USA Small Cap Index), Value (MSCI World ex USA Value Index), and Growth (MSCI World ex USA Growth Index). All index returns are net of withholding tax on dividends. World Market Cap represented by Russell 3000 Index, MSCI World ex USA IMI Index, and MSCI Emerging Markets IMI Index. MSCI World ex USA IMI Index is used as the proxy for the International Developed market. MSCI data © MSCI 2026, all rights reserved. Frank Russell Company is the source and owner of the trademarks, service marks, and copyrights related to the Russell Indexes.
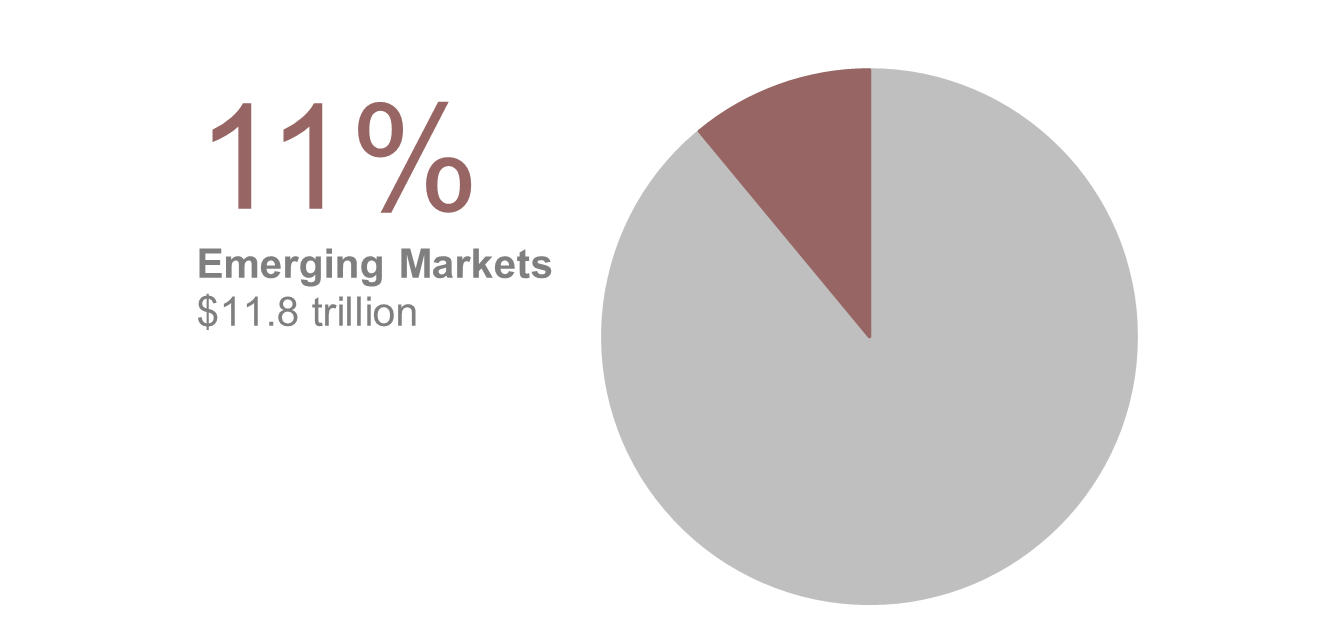
(2) Emerging Markets Stocks
Emerging markets posted positive returns for the year and outperformed both US and non-US developed markets, with the MSCI Emerging Markets Index up 33.57%.
Ranked Returns (%) - Emerging Markets
World Market Capitalization - Emerging Markets
Period Returns (%) - Emerging Markets
Past performance is not a guarantee of future results. Indices are not available for direct investment. Index performance does not reflect the expenses associated with the management of an actual portfolio. Market segment (index representation) as follows: Marketwide (MSCI Emerging Markets IMI Index), Large Cap (MSCI Emerging Markets Index), Small Cap (MSCI Emerging Markets Small Cap Index), Value (MSCI Emerging Markets Value Index), and Growth (MSCI Emerging Markets Growth Index). All index returns are net of withholding tax on dividends. World Market Cap represented by Russell 3000 Index, MSCI World ex USA IMI Index, and MSCI Emerging Markets IMI Index. MSCI Emerging Markets IMI Index used as the proxy for the emerging markets portion of the market. MSCI data © MSCI 2026, all rights reserved. Frank Russell Company is the source and owner of the trademarks, service marks, and copyrights related to the Russell Indexes.
Country Results
2025 INDEX RETURNS
Colombia recorded the highest country results, while Denmark posted the lowest returns for the year.
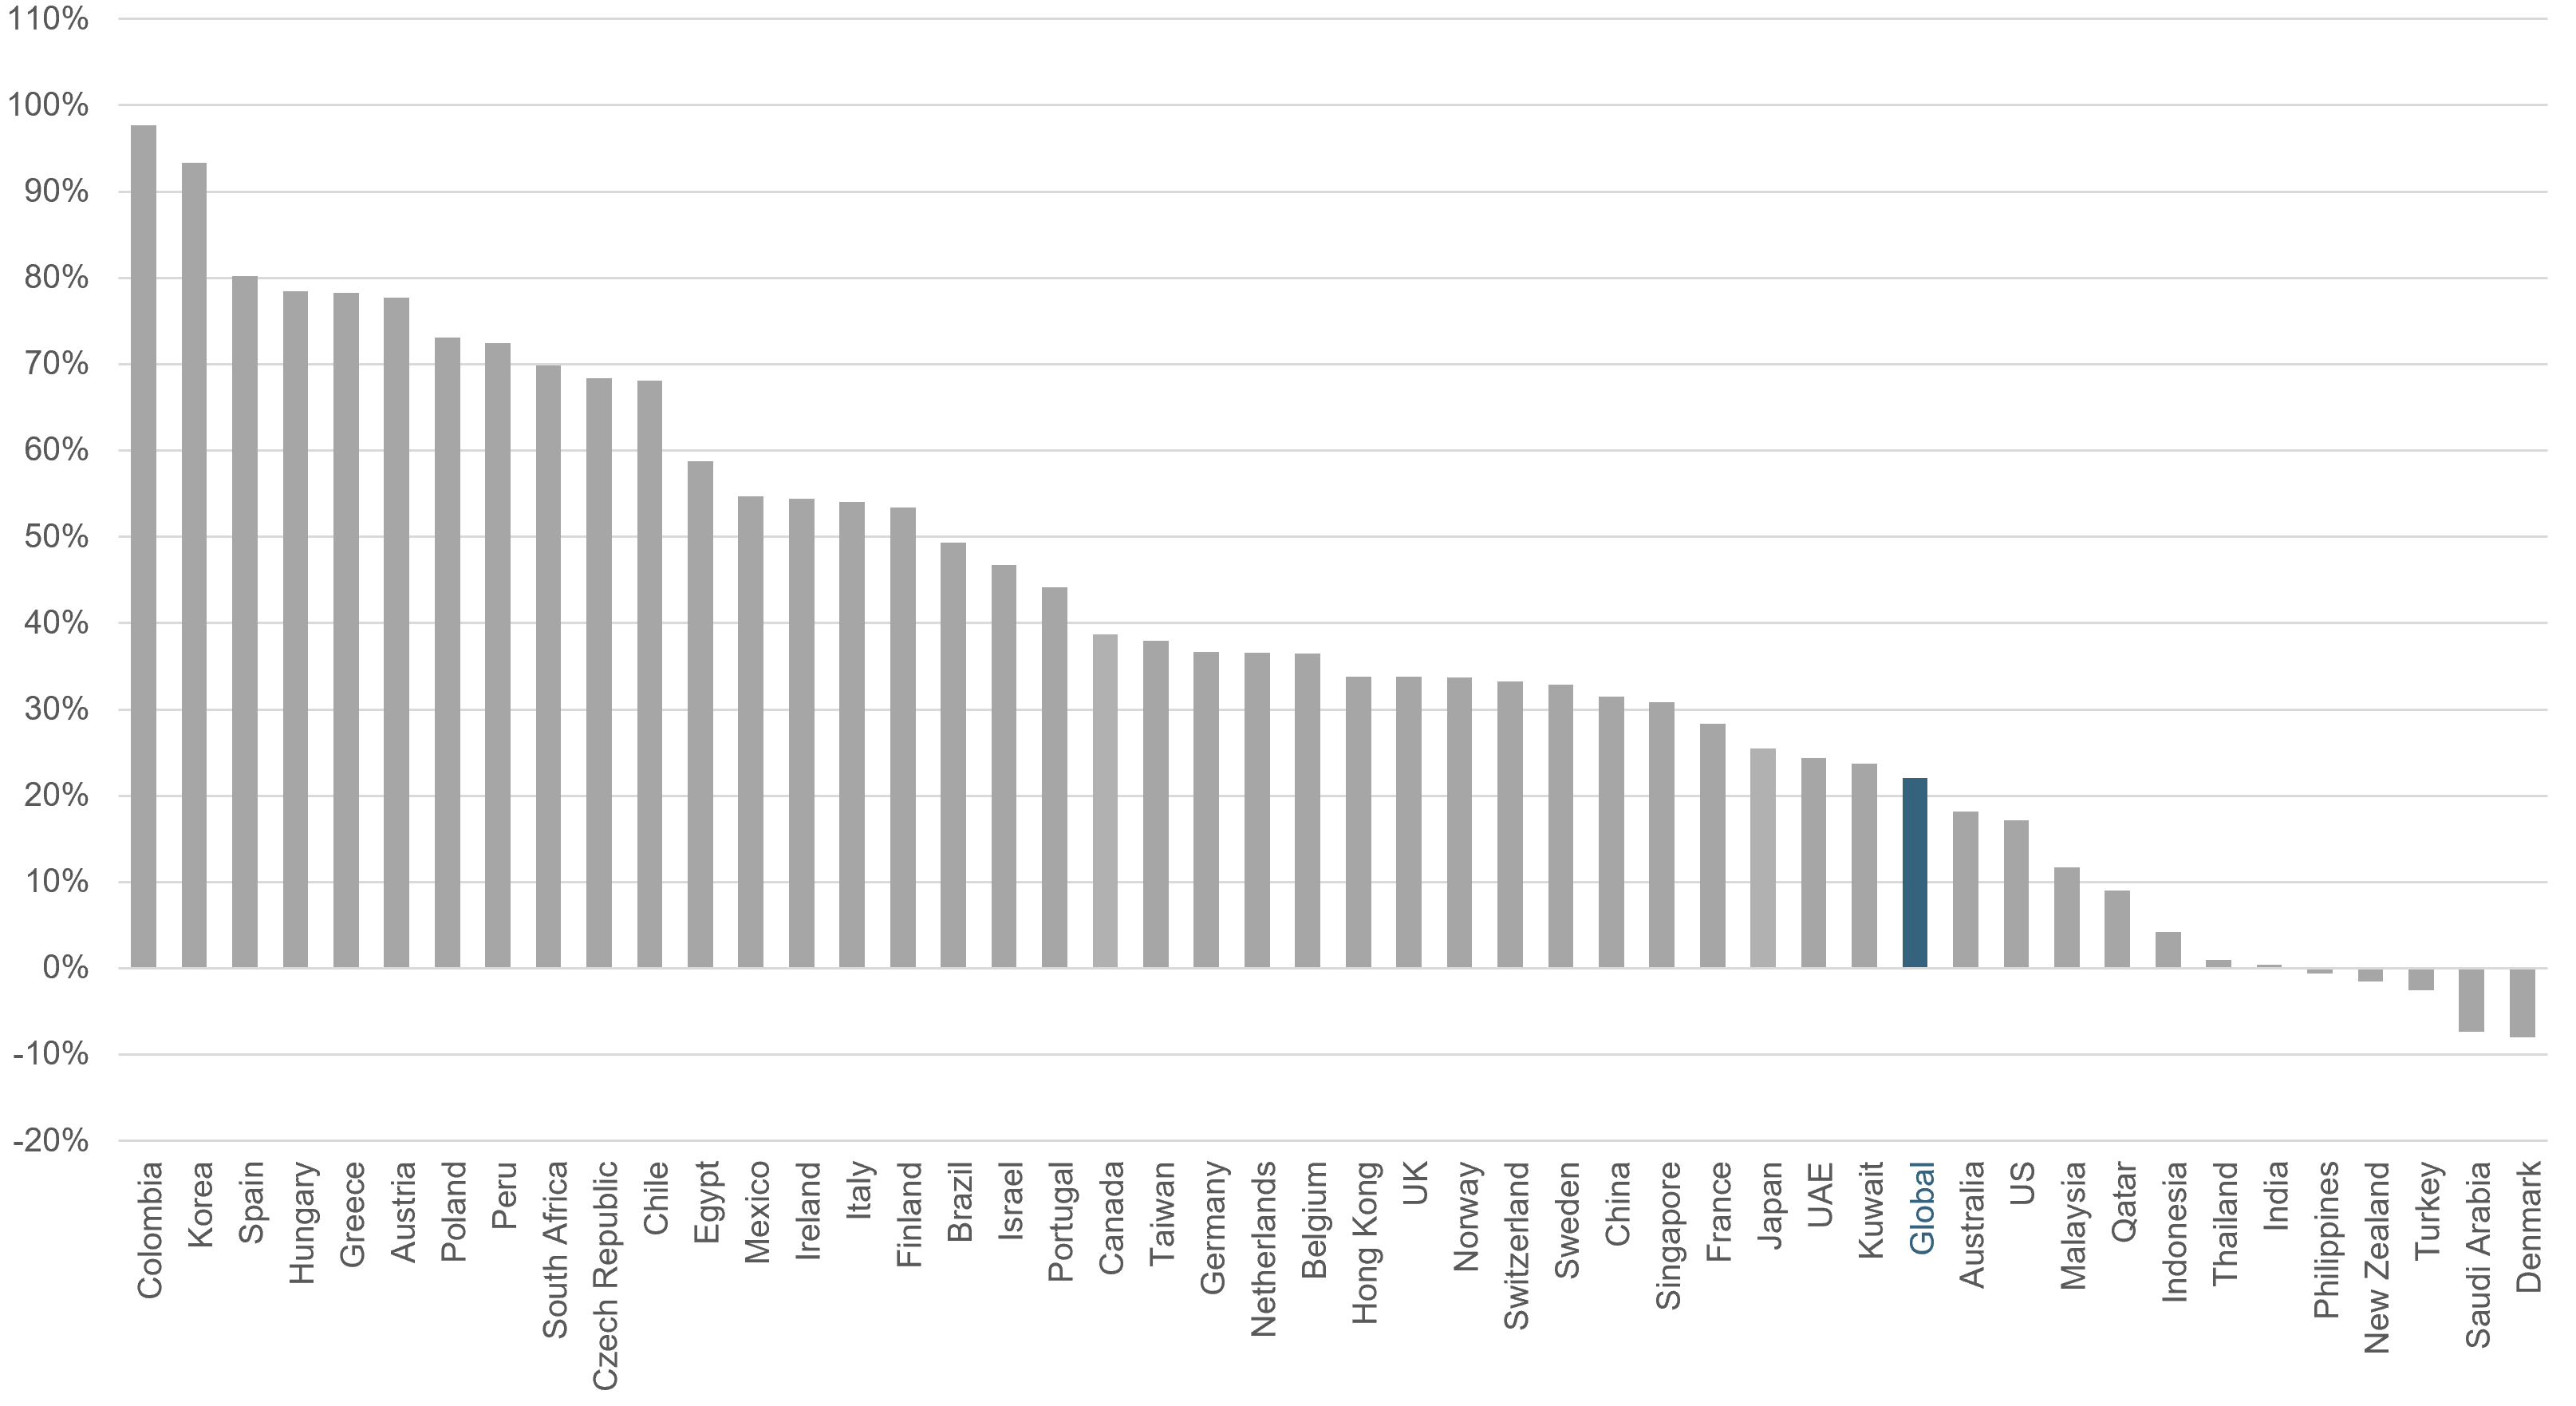
Past results is no guarantee of future results. Country returns are the country component indices of the MSCI All Country World IMI Index for all countries except the United States, where the Russell 3000 Index is used instead. Global is the return of the MSCI All Country World IMI Index. MSCI index returns are net dividend. Indices are not available for direct investment. Their performance does not reflect the expenses associated with the management of an actual portfolio. Frank Russell Company is the source and owner of the trademarks, service marks and copyrights related to the Russell Indexes. MSCI data © MSCI 2026, all rights reserved.
Real Estate (REITs)
2025 INDEX RETURNS
US real estate investment trusts underperformed non-US REITs during the year.
The Dow Jones US Select REIT Index rose 3.67%, while the S&P Global ex US REIT Index gained 24.29%.
Ranked Returns (%) - Real Estate
Total Value of REIT Stocks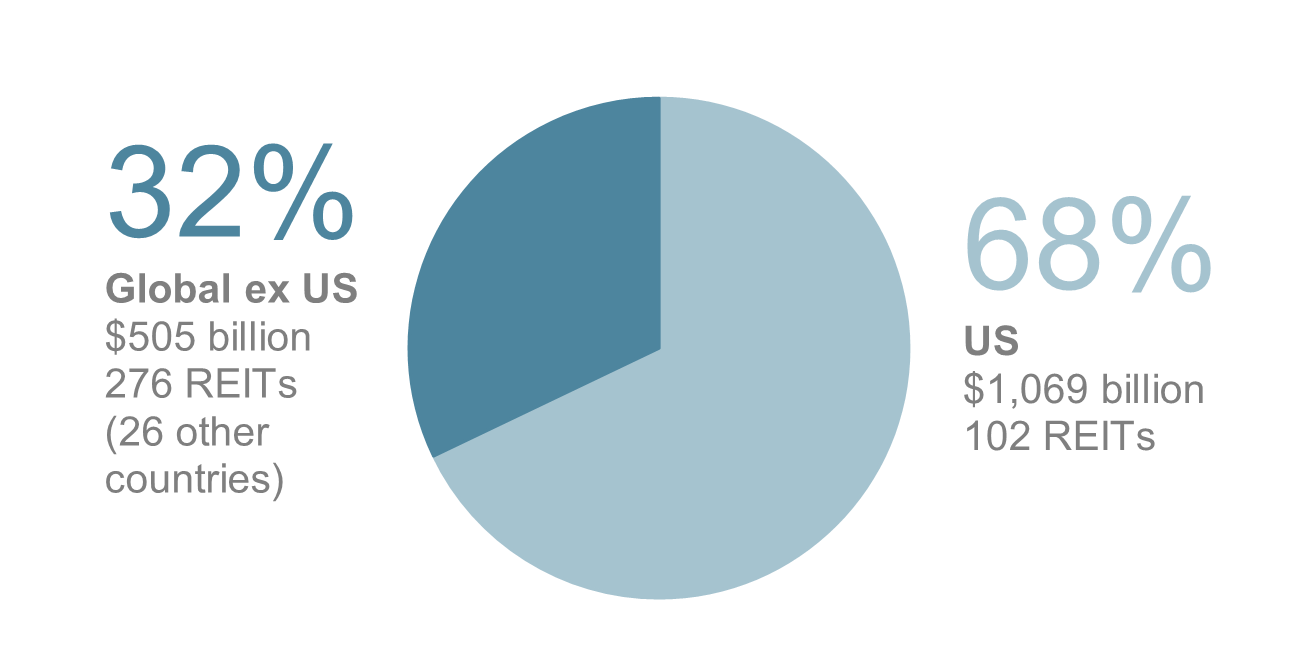
Period Returns (%) - Real Estate
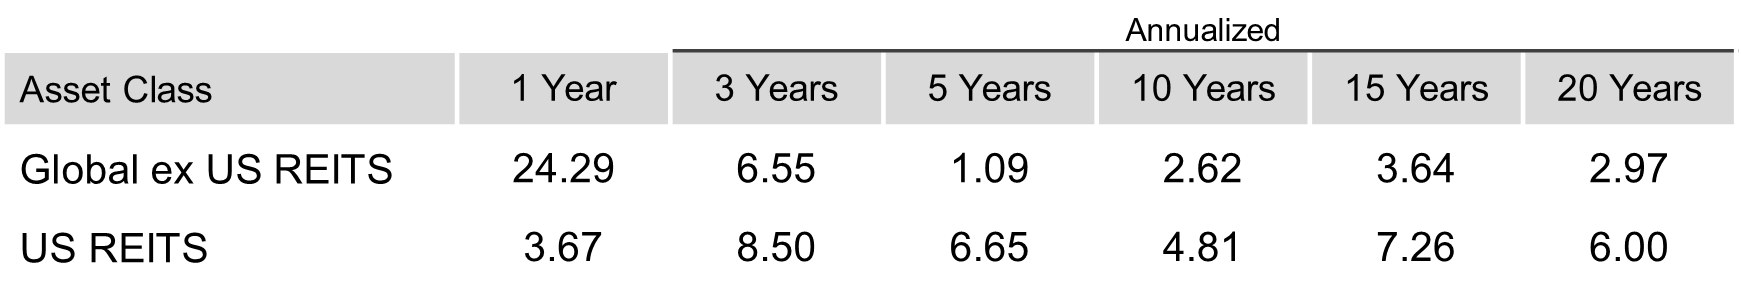
Past performance is not a guarantee of future results. Indices are not available for direct investment. Index performance does not reflect the expenses associated with the management of an actual portfolio. Number of REIT stocks and total value based on the two indices. All index returns are net of withholding tax on dividends. Total value of REIT stocks represented by Dow Jones US Select REIT Index and the S&P Global ex US REIT Index. Dow Jones US Select REIT Index used as proxy for the US market, and S&P Global ex US REIT Index used as proxy for the World ex US market. Dow Jones and S&P data © 2026 S&P Dow Jones Indices LLC, a division of S&P Global. All rights reserved.
Commodities
2025 INDEX RETURNS
The Bloomberg Commodity Total Return Index returned +15.77% for the year.
Natural Gas and Sugar were the worst performers, returning -21.88% and -21.11% for the year, respectively.
Silver and Gold were the best performers, returning +152.68% and +57.49% for the year, respectively.
Ranked Returns for Individual Commodities (%)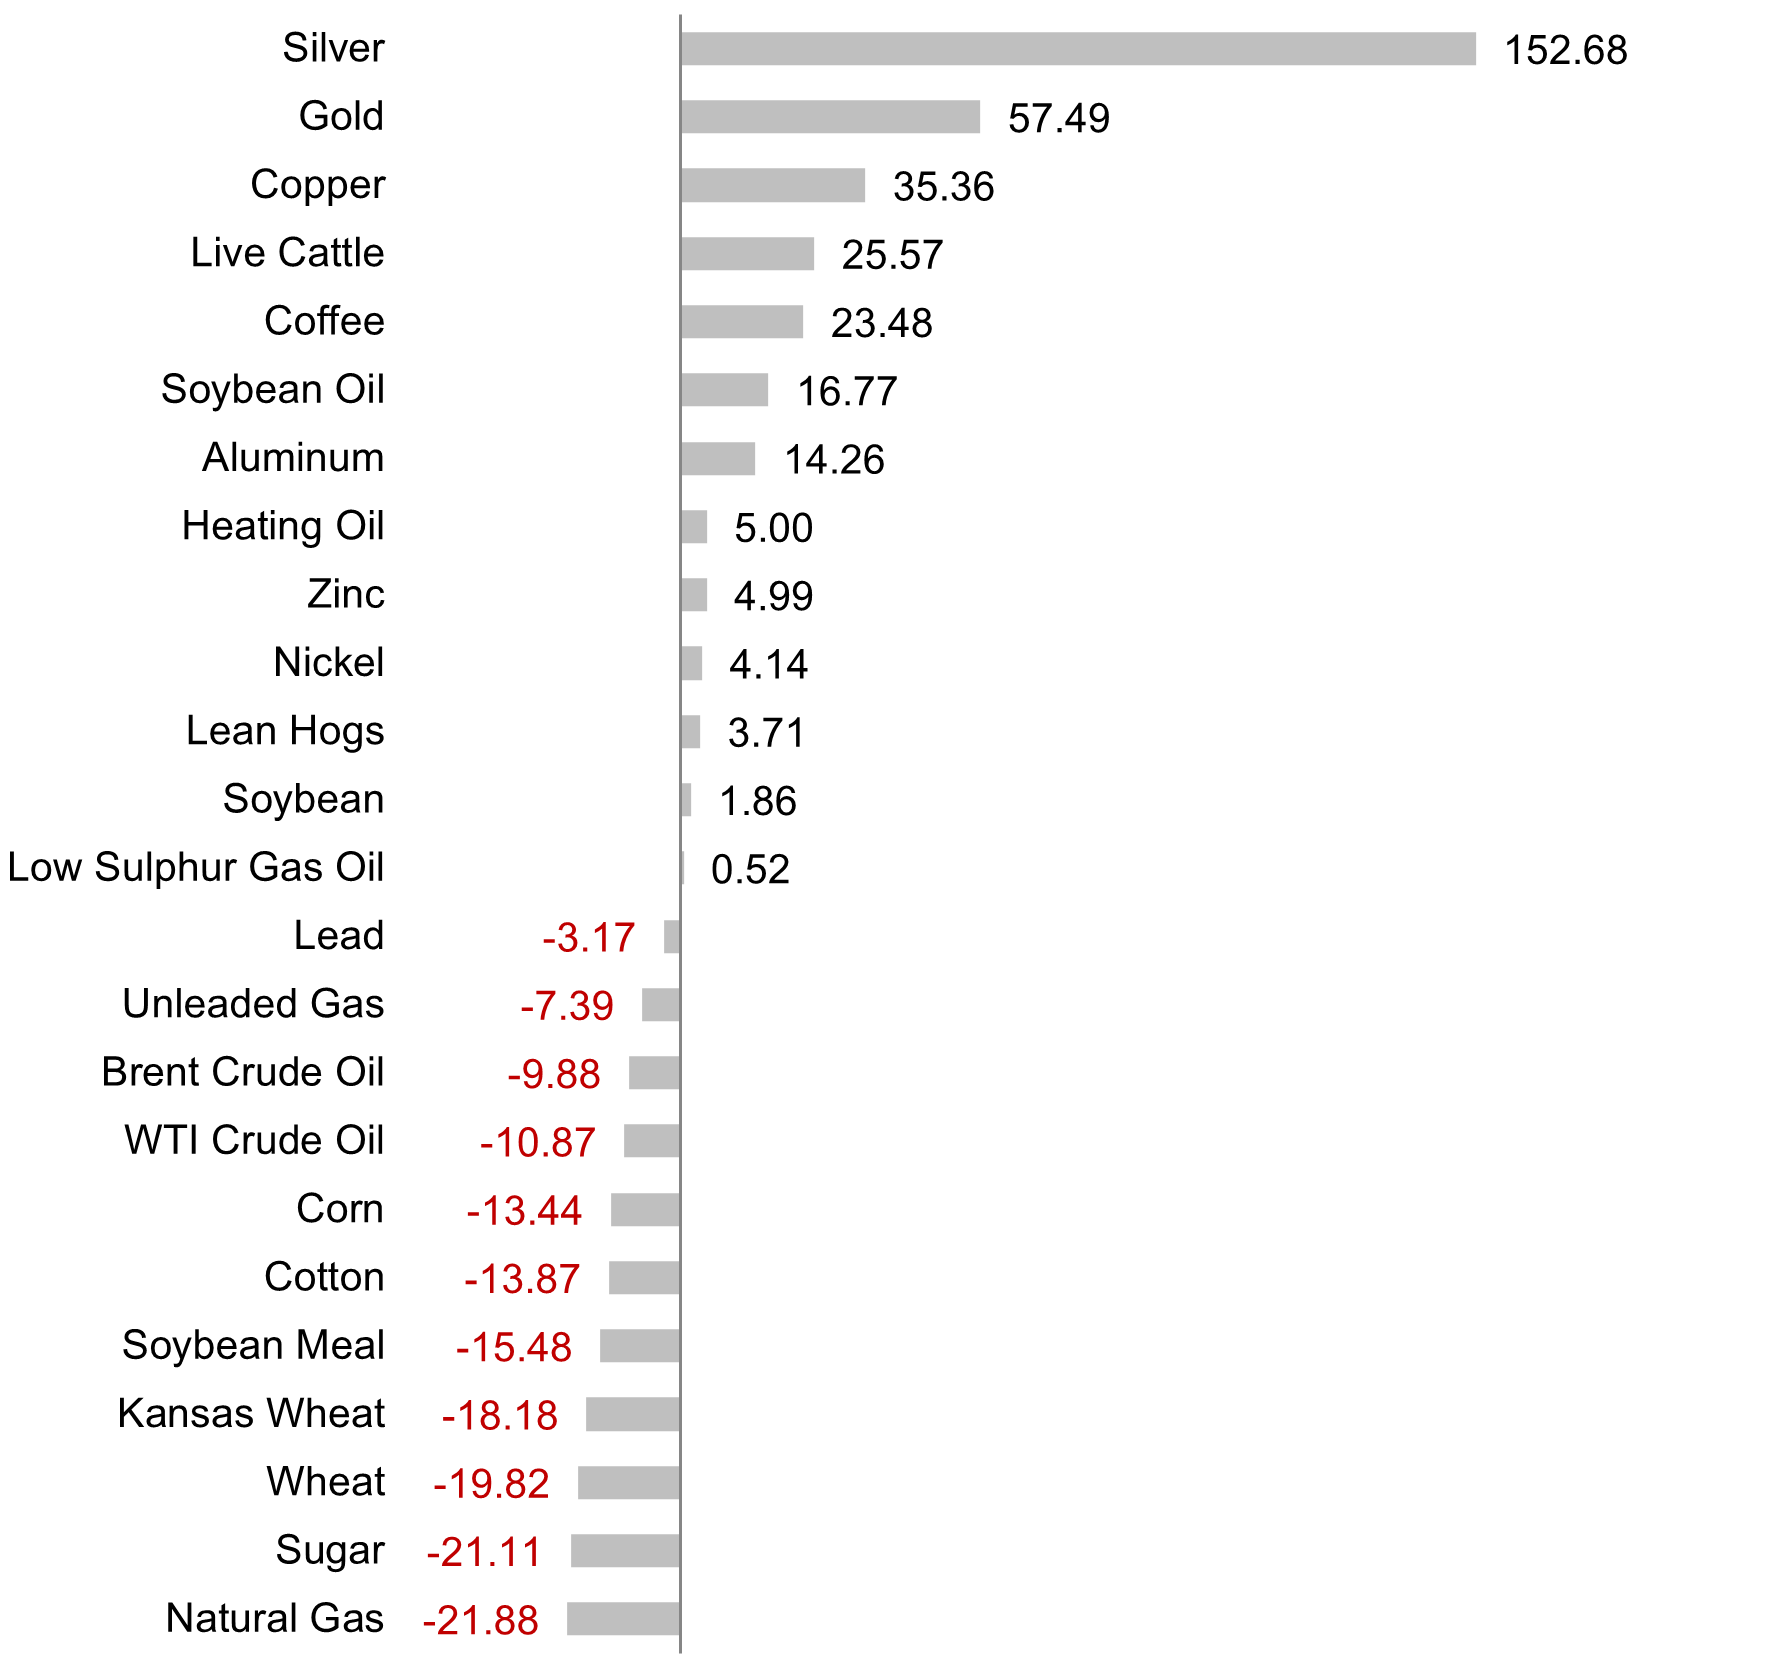
Period Returns (%) - Commodities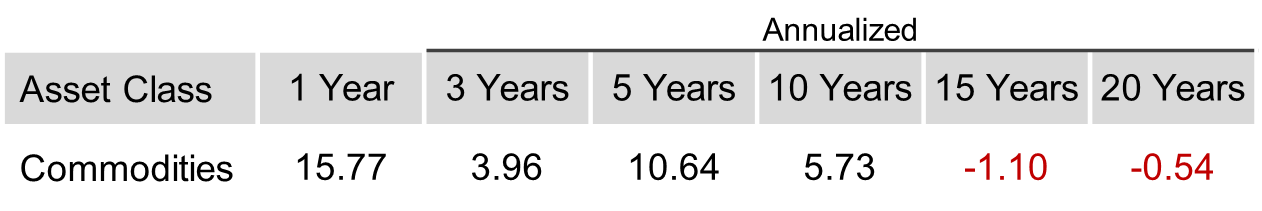
Past performance is not a guarantee of future results. Index is not available for direct investment. Index performance does not reflect the expenses associated with the management of an actual portfolio. Commodities returns represent the return of the Bloomberg Commodity Total Return Index. Individual commodities are sub-index values of the Bloomberg Commodity Total Return Index. Data provided by Bloomberg.
Bonds (Fixed Income)
2025 US YiELD CURVES
Within the US Treasury market, interest rates generally decreased during the year.
US Treasury Yield Curve (%)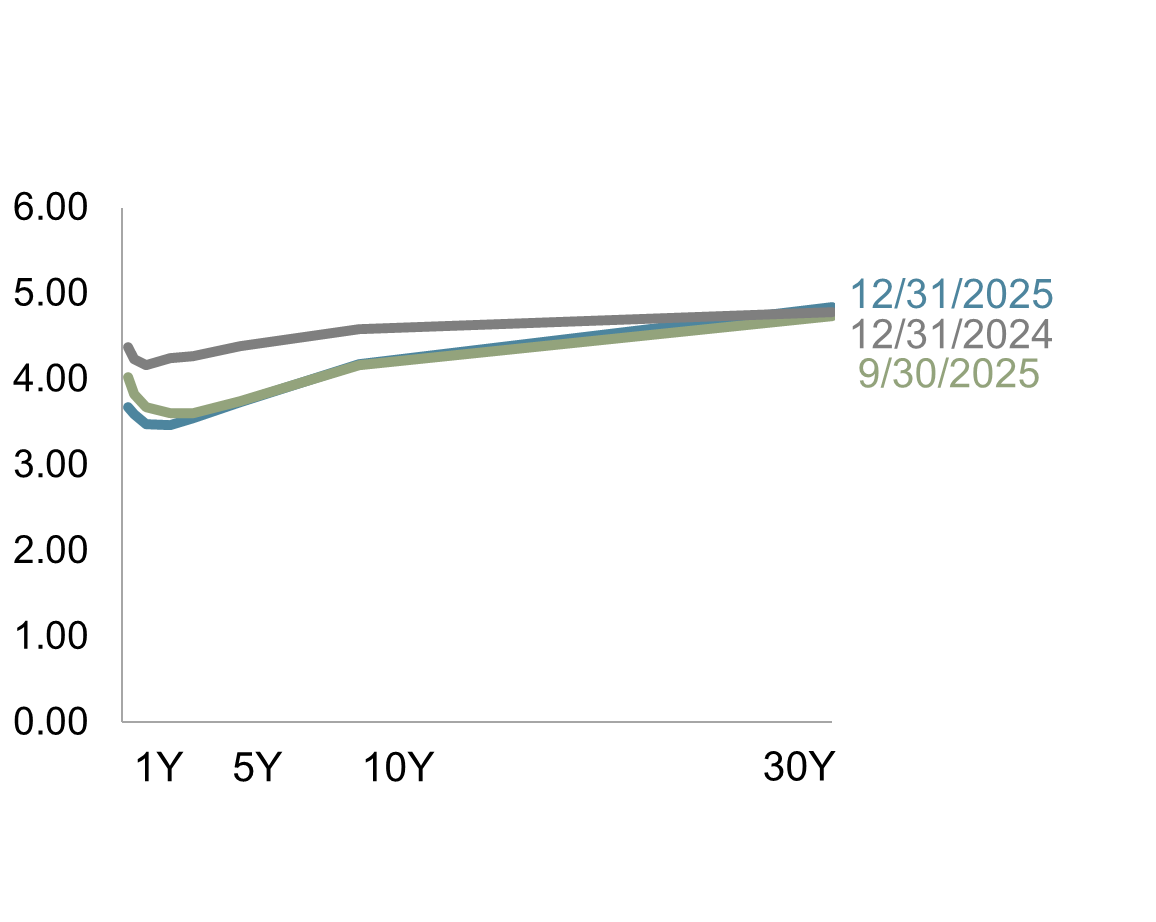
On the short end of the yield curve, the 1-Month US Treasury Bill yield decreased 66 basis points (bps) to 3.74%. The 1-Year US Treasury Bill yield decreased 68 bps to 3.48%. The yield on the 2-Year US Treasury Note decreased 78 bps to 3.47%.
The yield on the 5-Year US Treasury Note decreased 65 bps to 3.73%. The yield on the 10-Year US Treasury Note decreased 40 bps to 4.18%. The yield on the 30-Year US Treasury Bond increased 6 bps to 4.84%.
Bond Yields Across Issuers (%)

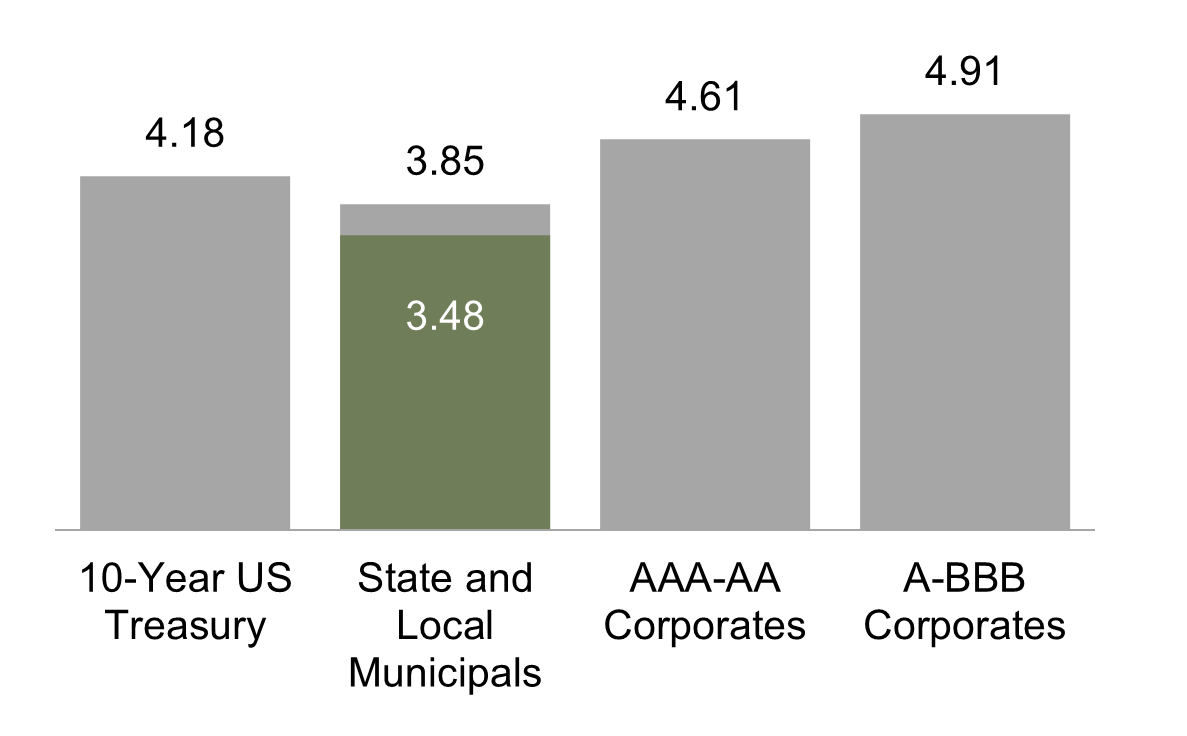
In terms of total returns, short-term US treasury bonds returned +5.84% while intermediate-term US treasury bonds returned +6.51%. Short-term corporate bonds returned +6.81% and intermediate-term corporate bonds returned +7.95%.6
The total returns for short- and intermediate-term municipal bonds were +4.11% and +5.75%, respectively.
Within the municipal fixed income market, general obligation bonds returned +4.31% while revenue bonds returned +4.21%.7
Period Returns (%)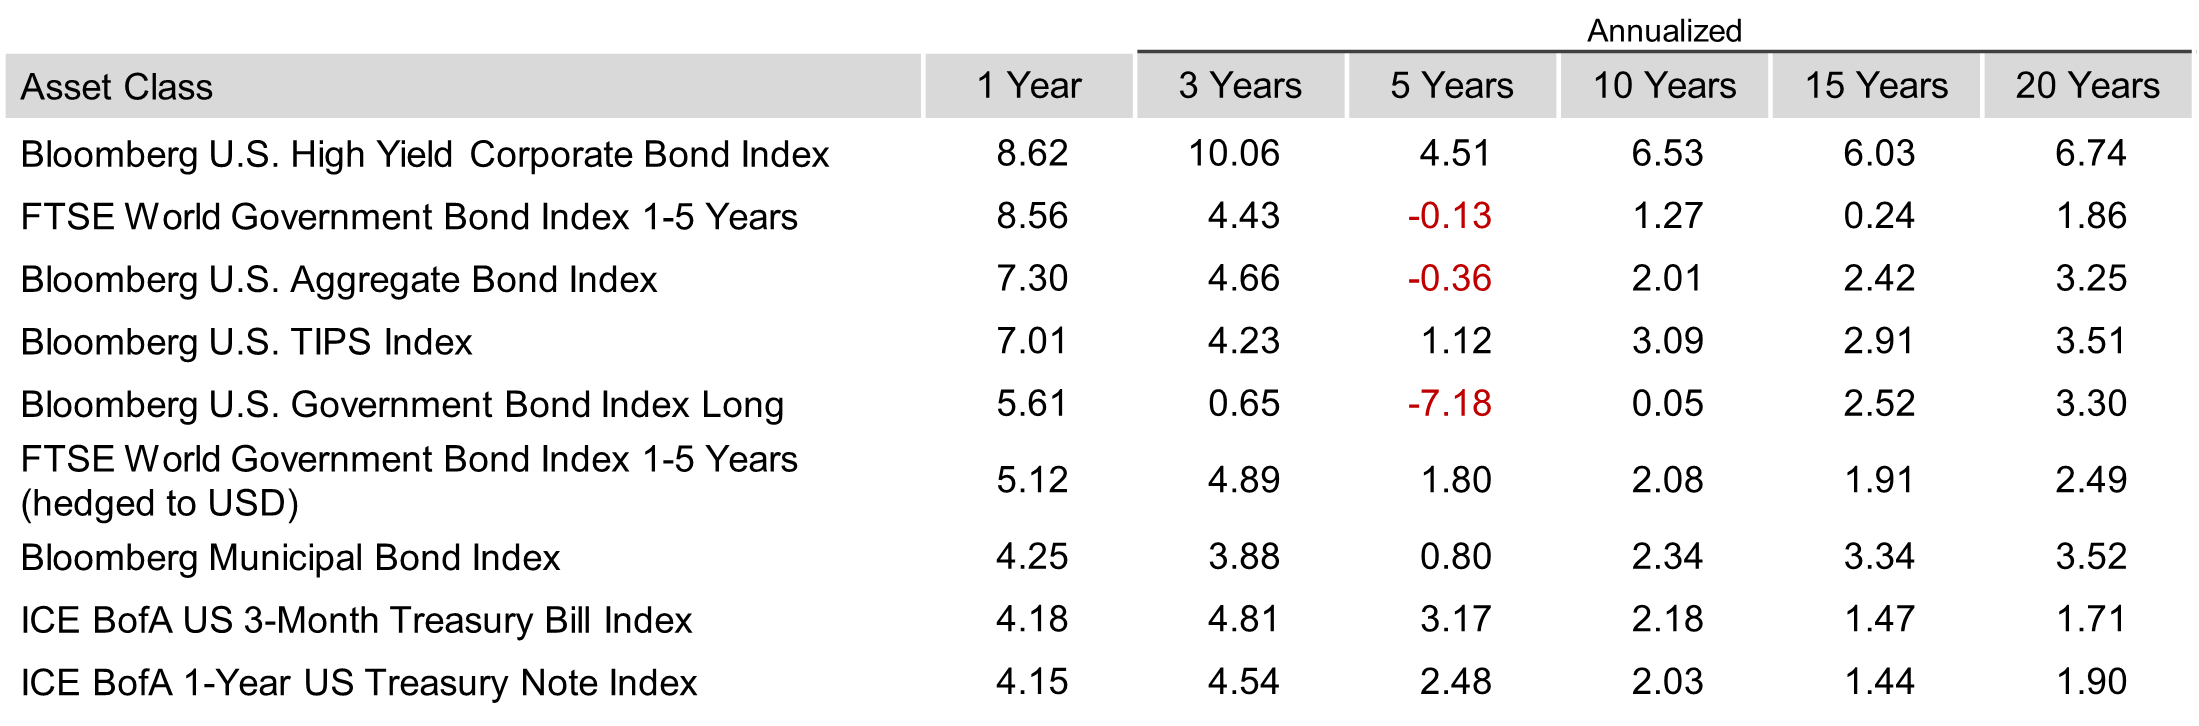
One basis point (bps) equals 0.01%. Past performance is not a guarantee of future results. Indices are not available for direct investment. Index performance does not reflect the expenses associated with the management of an actual portfolio. Yield curve data from Federal Reserve. State and local bonds, and the Yield to Worst are from the S&P National AMT-Free Municipal Bond Index. AAA-AA Corporates represent the ICE BofA US Corporates, AA-AAA rated. A-BBB Corporates represent the ICE BofA Corporates, BBB-A rated. Bloomberg data provided by Bloomberg. US long-term bonds, bills, inflation, and fixed income factor data © Stocks, Bonds, Bills, and Inflation (SBBI) Yearbook™, Ibbotson Associates, Chicago (annually updated work by Roger G. Ibbotson and Rex A. Sinquefield). FTSE fixed income indices © 2026 FTSE Fixed Income LLC, all rights reserved. ICE BofA index data © 2026 ICE Data Indices, LLC. S&P data © 2026 S&P Dow Jones Indices LLC, a division of S&P Global. All rights reserved.
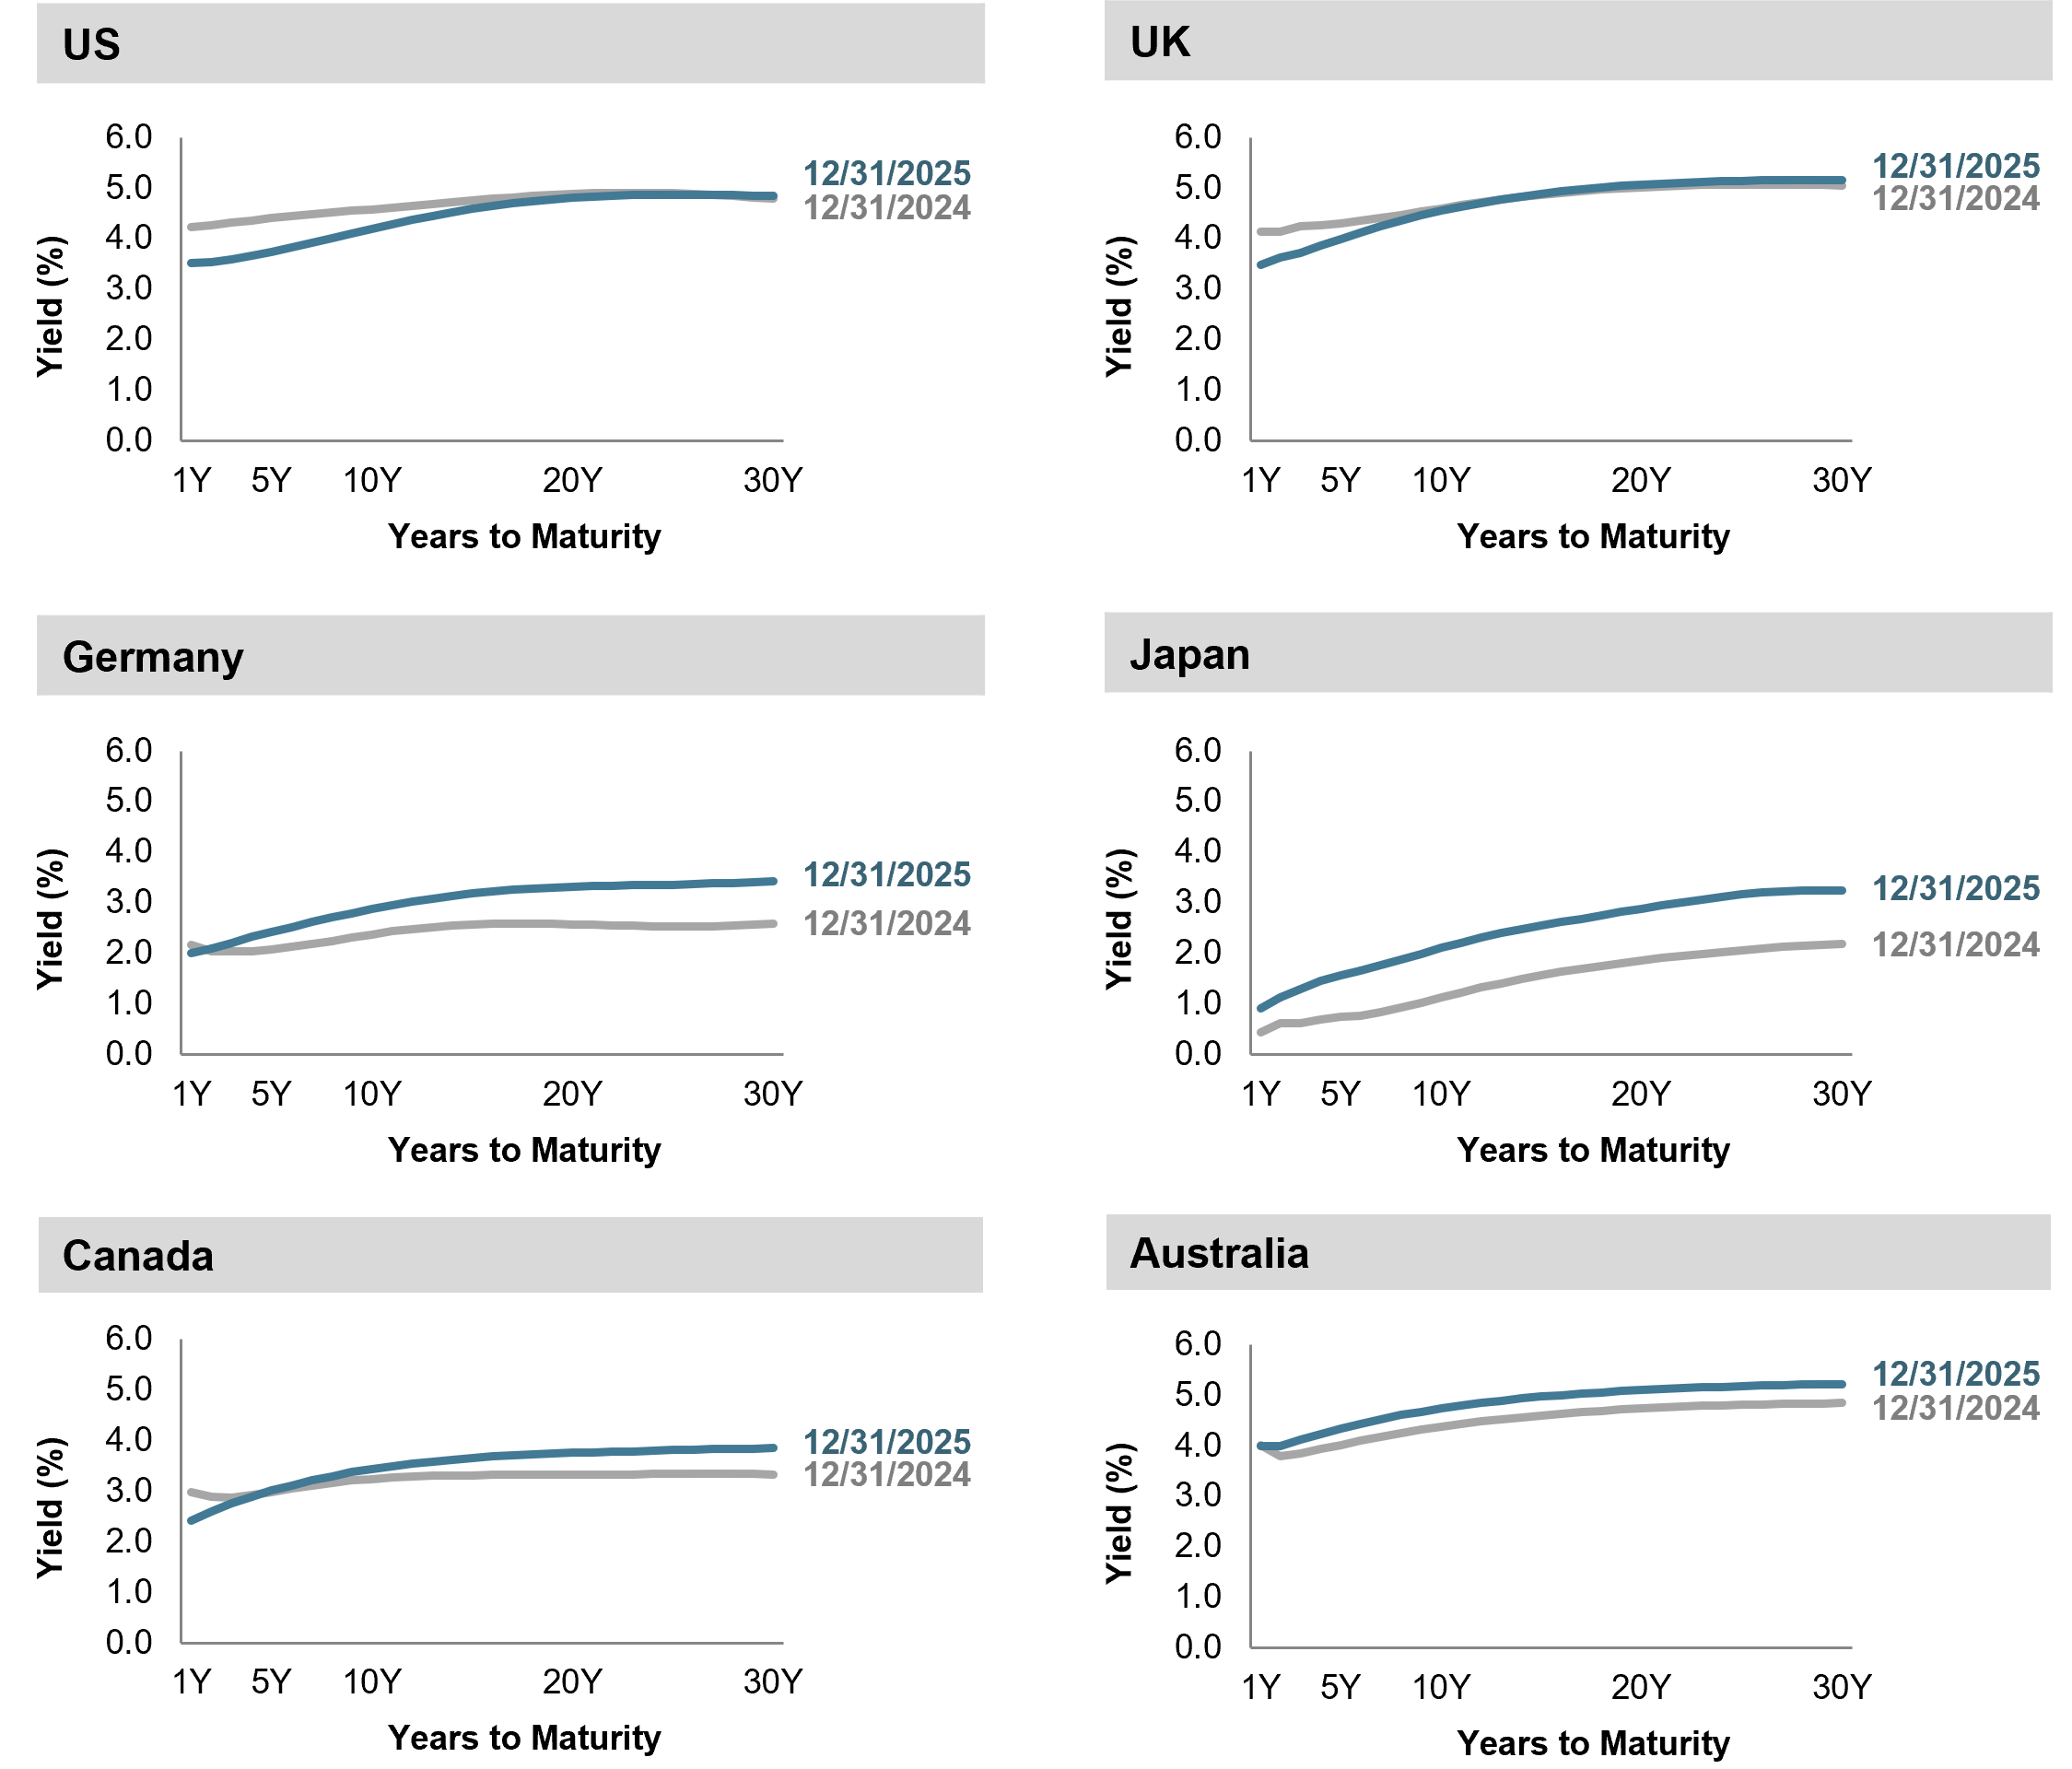
2025 Global Bonds
Except for the UK and US, interest rates generally increased across global developed markets for the year.
In the US, interest rates generally decreased. In the UK, short- to intermediate-term interest rates decreased, and long-term interest rates increased. In Canada, Germany, UK and Australia, the short-term maturity range of their yield curves was generally flat but steepened in the three- to five-year maturity range.
On aggregate, global term premiums were mixed. Realized term premiums were mixed in the US and UK, as intermediate-term bonds generally outperformed shorter and longer-term bonds. However, realized term premiums were generally negative in Canada, Germany and Japan, as longer-term bonds generally underperformed shorter-term bonds for the year.
Changes in Yields (bps) since December 31, 2024
One basis point (bps) equals 0.01%, so, in the table below, "-70.7" equals -0.707%.
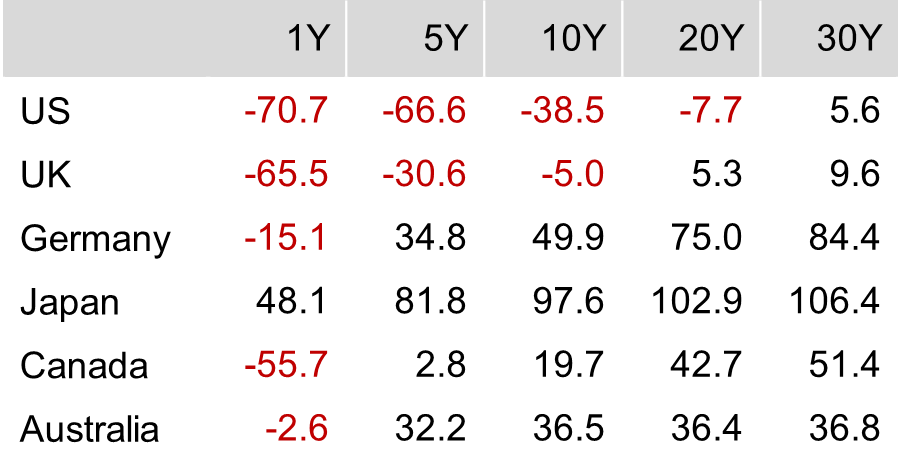
Source: ICE BofA government yield. ICE BofA index data © 2026 ICE Data Indices, LLC.
So, What Will 2026 Bring?
That question is always tempting, and always unanswerable.
Markets will surprise us. Winners will change again. Some risks we worry about will fade, and others we are not yet discussing will emerge. Returns will not arrive in a straight line.
What we do know is this:
Markets do not require perfect foresight to reward disciplined investors.
They require a thoughtful plan, broad diversification, sensible risk management, and the ability to stay the course when things feel uncomfortable.
This is more than a market outlook; it is a planning philosophy.
What we shared above is a detailed look at how markets performed across asset classes and regions in 2025. The numbers are important, but they are only useful when viewed through the lens of long-term decision-making, personalized to you.
If this feels right to you, we invite you to join us. Reach out to say hello, and let's discuss any questions you might have.
As always, our focus remains unchanged. Instead of trying to predict the next year, we help families establish financial legacies across generations as a stronghold designed to endure (or continue celebrating) all of the years ahead.
ASK US TO SHOW YOU WHERE YOU STAND.
You can reach us at (775) 827-0670 and advice@openwindow.com. Send us a quick note at www.openwindow.com/quicknote or schedule a 'Quick Connection' time with us at www.openwindow.com/connection.
FOOTNOTES & SOURCES
Content was provided by Dimensional Fund Advisors, LP, and adapted by Open Window Financial Solutions, Ltd.
- Returns calculated using the CRSP US Total Market Index annualized return from 01/01/25 to 12/31/25
- David Goldman, "Dow plunges 2,200 points as tariff tumult rocks markets," CNN, April 4, 2025
- Joe Rennison, “Late Rally Pushes Stocks Back Near Record High,” The New York Times, November 28, 2025.
- S&P data © 2025 S&P Dow Jones Indices LLC, a division of S&P Global. All rights reserved. Indices are not available for direct investment. Their performance does not reflect the expenses associated with the management of an actual portfolio; Ben Levisohn, “S&P 500 Hits a Rare Christmas Eve Record,” Barron’s, December 24, 2025.
- Martin Baccardax, “One Earnings Report Can’t Erase the Stock Market’s AI Bubble Concerns,” Barron’s, November 20, 2025; Rachel Treisman, “The Government Shutdown Is Now the Longest in US History. See How It Compares,” NPR, November 5, 2025.
- Bloomberg US Treasury and US Corporate Bond Indices.
- Bloomberg Municipal Bond Index.